As part of QUADRAT’s training programme, you can do a three-month internship with an organisation of your interest and relevant to your PhD. In November 2020 I got accepted to do an internship with the Joint Nature Conservation Committee (JNCC). JNCC is public body that advises the UK Government and devolved administrations on nature conservation issues at a UK and European Level.
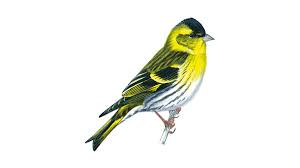
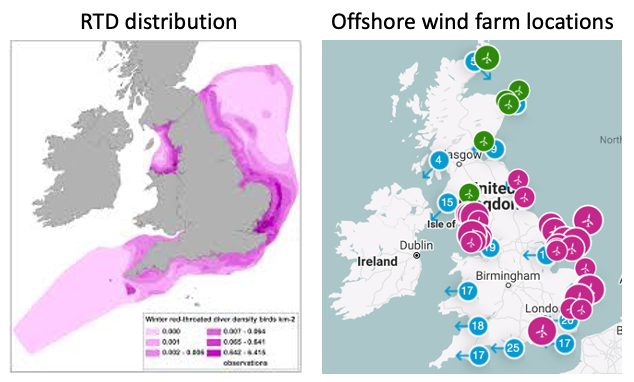
For my internship I worked with the Marine Species Team with Dr Kerstin Kober, a senior marine ornithologist at JNCC, as my supervisor. Together we worked on exploring the existing modelling techniques and data availability for the production of habitat suitability maps for overwintering red-throated divers. Habitat maps are an important and useful tool for understanding the scale of habitat loss particularly to this species due to factors such as construction and operation of offshore wind farms. Red-throated divers (hereafter ‘divers’) are an aquatic migratory bird which overwinter exclusively in marine areas across the North Sea. In the North Sea there is a rapid expansion of offshore wind farm development for offsetting greenhouse gas emissions. Although this seems good news, divers are highly sensitive to marine industry activities and the areas of activity overlap with the habitat of divers (Figure 1). Wind farms and ships are big, sometimes noisy and take up a lot of space so divers often exhibit flush disturbance (basically flying away) effectively displacing divers from the area – who wouldn’t be disturbed by them when all you want to do during the winter is eat in peace?
As a result of these marine industry activities, increasing concern has been raised over the need to quantify this effective habitat loss but studies looking at local, UK-wide and North Sea scale effects have not been quantified. My internship tried to help understand this problem by looking at how feasible modelling the habitat of divers can be done, what data is needed and what data is available. By knowing the current distribution of divers, we can then try to figure out what habitat is available/unavailable for divers from environmental factors which influence their movements. This brings us to the first question: what data is required to model habitat? This can be divided into two main sections: 1) red-throated diver survey data; and 2) environmental covariates which influence diver distribution. Diver distribution has been surveyed since the late 1970s and carried out by aerial surveys using planes with observers or cameras to count the divers over a given transect, or boat surveys with observers to count the divers in the transects. Although these surveys tell us where the divers currently are, it does not tell us where they could or couldn’t go and it is dependent on where we go to look for them. To overcome these issues this is where modelling habitat can help us, and this brings us to the second section: environmental covariates for predicting diver presence. To predict presence, we can further divide the covariates into two main drivers of diver distribution: disturbance variables (e.g., offshore wind farms, shipping activity) to the prey location, the main issues affecting diver distribution. However, we will encounter a major challenge with prey location as obtaining this type of data is not feasible due to the broad spectrum of diver diet and course spatial resolution. Instead, we can look at environmental proxies to act as surrogates for prey location such as static covariates (do not change over time) which include sediment, bathymetry, distance to coast and dynamic covariates (do change over time) such as shipping traffic, OWFs, surface temperature and stratification for example.
Once we had established what covariates we require, we then looked at how easily it is to obtain data on red-throated diver distribution and the environmental covariates through searching on the world wide web and contacting various organisation that would hold this data. We found that there was a myriad of platforms which hold red-throated diver data and environmental covariates such as JNCC for red-throated diver surveys and static covariate data from The European Marine Observation and Data Network. Most of this data is publicly available or requested from the owner as long as they are properly cited. The main challenges someone would face with trying to get this data is the fact that willingness of the data owner to share the data is not so easy. This is a major problem particularly for data on OWFs as this is usually commercially sensitive so it’s unlikely the OWF developers would want their data published. Additionally, we found it difficult to find environmental covariate data to align with the time frame and location as red-throated data surveys and the spatial resolution of some data files would just be too course to try to model with the red-throated diver data. Another major spatial challenge is data availability at different spatial scales not being equal across the three major scales so from the smaller local areas such as the outer Thames estuary and further UK-wide, which are readily available to use, however in the North Sea around NW Europe diver data is harder to obtain so if you want to predict distributions across NW Europe we would need to data collect from other countries such as Germany.
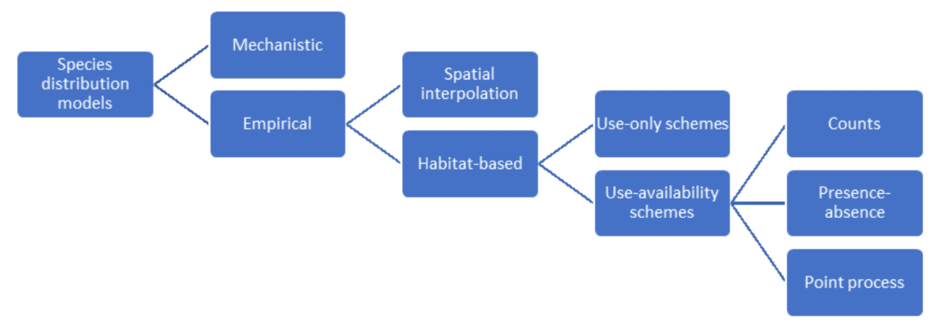
The final step in this report was to look at the different modelling approaches available for habitat suitability mapping. There are various types of models which can be used to assess habitat suitability of red-throated divers. We started by following the paper by Jason Matthiopoulos et al (2020) on the ‘Taxonomy of species distribution models’, whereby species distributions could be modelled by mechanistic models where distributions are based on theory or empirical models where distributions are based on direct observation (Figure 2). Empirical models are much more common because they are experimental and so for red-throated divers we would stick to empirical modelling as data on their distribution has been recorded. So, there are two routes with empirical modelling: spatial interpolation and habitat-based modelling. Spatial interpolation models estimate species densities; however, this approach requires lots of existing data from surveys which for diver data is too sparse or sometimes absent on a wider UK and North Sea scale. Therefore habitat-based modelling, which considers the species-habitat relationship (and hence why we include the environmental covariates) is the most suitable approach for predicting distribution based on available diver and environmental covariate data. Habitat-based models then branch off in to two more routes depending on the type of animal survey you have conducted: use-only schemes where the diver data only records presence and use-availability schemes where the presence and absence of the individual from the area surveyed. Use-only schemes are slightly blunt as the model will only look at the habitat preference of the individual, but these can be used for climate envelopes. Whereas use-availability schemes can give a stronger indication of where the species will and won’t distribute to since data is available for where they are not present. There are a lot of statistical methods that can be used for modelling habitat suitability from relatively simple Generalised Additive Models or Generalised Linear Models to complex point-process methods such as MaxEnt or INLA. The choice the dependent on how comfortable you are with using these methods and the suitability of the data available.
After a lengthy written report, multiple spreadsheets of data and a decision tree, my report will hopefully be published soon. I would recommend any PhD students interested in working outside of academia to apply for an internship.
Header photo by Nicholas Doherty on Unsplash.
References
References Matthiopoulos, Jason; Fieberg, John; Aarts, Geert. (2020). Species-Habitat Associations: Spatial data, predictive models, and ecological insights. University of Minnesota Libraries Publishing. Retrieved from the University of Minnesota Digital Conservancy, http://hdl.handle.net/11299/217469.