Novel Tools for Quantifying and Managing Nutrient and Sediment Losses from Agricultural Land
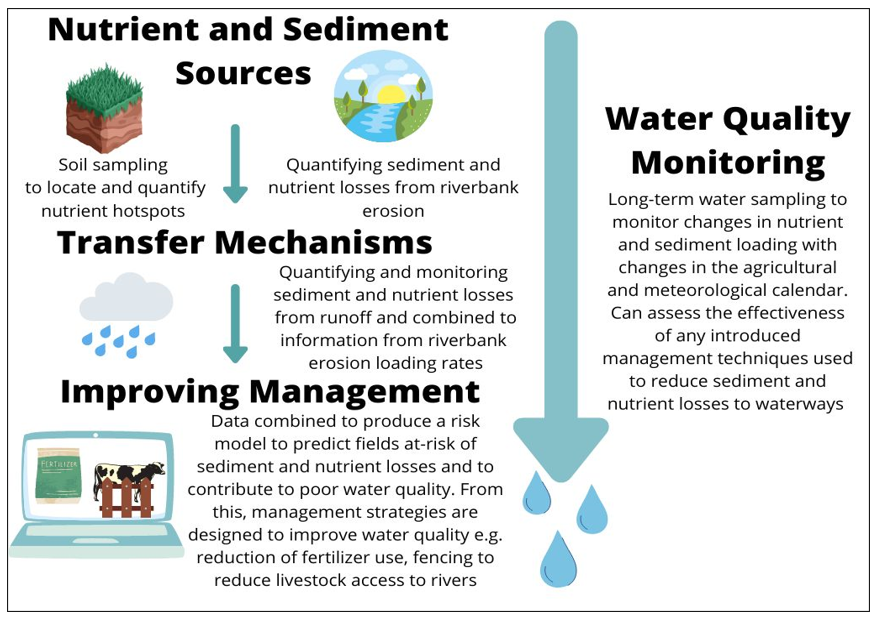
Agricultural activities are major contributors to poor water quality through their high losses of sediment and nutrients. To develop targeted management techniques to improve water quality, a greater understanding of the appropriate scale of the sources and transfer mechanisms for nutrient and sediment losses is required. A particular emphasis is placed on phosphorus (P) given its role in eutrophication occurrence. This research project aims to quantify and manage nutrient and sediment losses from 8 grassland sites at the sub-field scale through a multi-method approach in the cross-border Blackwater catchment. Field-based sampling techniques alongside remote sensing and modelling methodologies are used in this research. This project benefits from being part of a CASE studentship with AFBI (Agri Food and Biosciences Institute). A general graphic of the main research conducted is included in Figure 1.
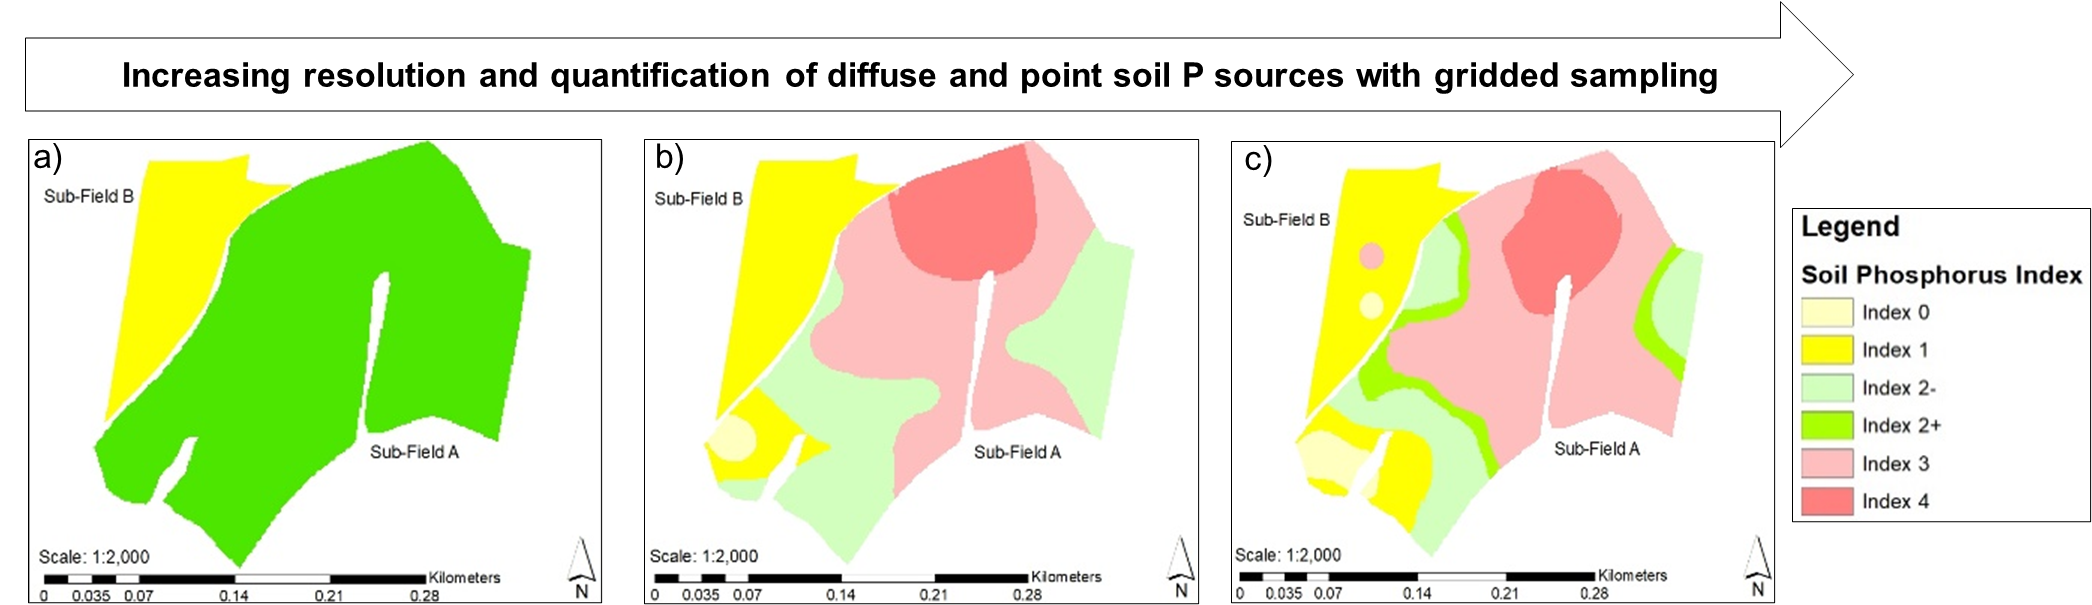
Quantification of soil P sources at-risk of contributing to eutrophication occurred using gridded soil sampling (at two resolutions 35 m and 70m) and using bulked W sampling, with wide variability found in P at the sub-field scale. Increasing soil P index values indicate a higher risk of P losses beyond the agronomic optimum value of Index 2. Figure 2 demonstrates the differences in soil P content determined by the different soil sampling strategies (bulked sampling routinely underpredicts soil P content). Bulked sampling is inappropriate for use in determining areas at-risk of P losses as it misses crucial areas of P accumulations with an increased need for the use of gridded soil sampling techniques. 35 m intervals were determined as optimal for soil sampling strategies to identify and quantify soil P sources.
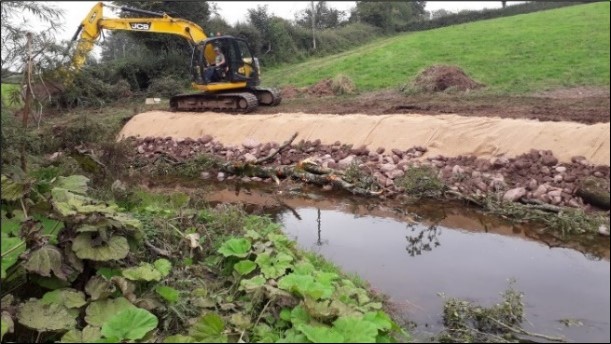
Calculating riverbank erosion and associated sediment and P loading rates are traditionally difficult given the highly site-specific nature of erosion and can involve accessing dangerous areas for survey. Annual average riverbank erosion, sediment, and P loading rates onto waterways were quantified using LiDAR data in combination with bulk sampling data in an image differencing analysis that allowed for off-site calculations of these rates. Riverbanks which showed high losses and erosion rates were targeted for soft-engineering stabilisation techniques as shown in Figure 3. Of interest is understanding what effects the stabilisation technique had on erosion, sediment and P loading rates. Again LiDAR data with an image differencing analysis was used which determined that erosion, sediment and P losses were reduced by over 86%, indicating the success of this feature to reduce losses from riverbank erosion. Using remote sensing allows programmes to monitor the success of introduced strategies and to explore the financial viability of such schemes on a longer-term basis and any downstream impacts of the feature’s introduction.
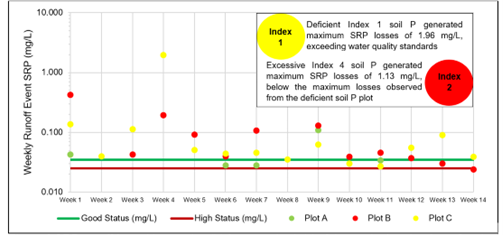
Runoff-based P and sediment losses were quantified at the sub-field scale using runoff plots with the magnitude of P losses found to be unrelated to soil P concentrations. Hydrologically connected deficient soil P posed higher risks for eutrophication occurrence than P hotspots (as shown in Figure 4 for soluble reactive P losses) suggesting that a re-evaluation of the highest risk areas for poor water quality from a P perspective is required.
Furthermore, statistical analysis found that the controls influencing runoff generation were highly variable between the runoff plots. Rainfall amounts, rainfall intensities, soil moisture, relative drainage areas and lengths of runoff flow pathways contribute to nearly 80% of the variance in runoff occurrence and volumes. Given the geographic variations in rainfall characteristics, soil moisture conditions and flow pathways, this indicates that the generation of runoff is variable both spatially and on a meteorological basis.
Combining sub-field scale datasets on the sources and transfer mechanisms of sediment and nutrients within a GIS-based risk model using a weighted overlay allowed the visualisation of the highest risk P and sediment delivery zones to waterways. Figure 5 shows a schematic of the model’s general design.
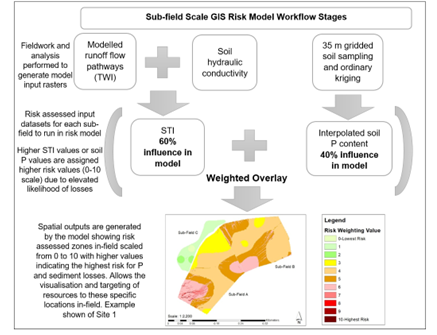
Visualising these risk-assessed zones allows the cost-effective targeting of water quality improvement schemes to specific locations e.g. for Site 1 in Figure 8, the highest risk values (7-10) are located in sub-field A, spatially this is a field drainage ditch which connects to the waterway at this site, elevating the risk of P and sediment losses. Targeting intervention strategies to these specific high-risk locations avoids the blanket generalised application of catchment management techniques and avoids financial wastages and the removal of large areas of land from agricultural productivity. Monthly water sampling monitored water quality changes for two years (2020-2022) and allowed validation of risk modelling assessments to be performed with data showing that higher risk-weighted grassland sites corresponded to poorer instream water quality conditions.
This research demonstrates that there is a need for increased sub-field scale data and that a re-evaluation of the risk of sediment and nutrient losses from permanent grasslands is needed to understand the sources and transfer mechanisms contributing to poor water quality. Future studies must analyse the sub-field scale sources and transfer processes for nutrient and sediment losses operating within permanent grasslands to improve water quality from an agricultural perspective.
Publications Related to this Research
Hayes, E., Higgins, S., Mullan, D. and Geris, J. (2021). Combining sub-field scale soil sampling and GIS interpolation techniques for mapping nutrient hotspots. EGU General Assembly 2021, Vienna, Austria, 19-30 Apr 2021, EGU21-2653. https://doi.org/10.5194/egusphere-egu21-2653, 2021.
Hayes, E., Higgins, S., Geris, J. and Mullan, D. (2021). Using LiDAR derived Digital Terrain Models and field data to quantify riverbank erosion and nutrient loading rates. In T Astor & I Dzene (eds), Proceedings of the 21st Symposium of the European Grassland Federation: Sensing – New Insights into Grassland Science and Practice. vol. 26, The Organising Committee of the 21st Symposium of the European Grassland Federation, Universität Kassel, Grassland Science and Renewable Plant Resources, Steinstrasse 19, 37213 Witzenhausen, Germany, Online.196-198.
Hayes, E., Higgins, S., Geris, J. and Mullan, D. (2022). Grassland Reseeding—Improving Grassland Productivity and Reducing Excess Soil Surface Nutrient Accumulations. Chemistry Proceedings. 10(1), 4. https://doi.org/10.3390/IOCAG2022-12182
Hayes, E., Higgins, S., Geris, J. and Mullan, D. (2022). Grassland reseeding: impact on soil surface nutrient accumulation and using LiDAR-based image differencing to infer implications for water quality. Agriculture. 12(11), 1854. https://doi.org/10.3390/agriculture12111854
Hayes, E., Higgins, S., Geris, J., Nicholl, G. and Mullan, D. (2023). Weighted risk assessment of critical source areas for soil phosphorus losses through surface runoff mechanisms. CATENA. In review.