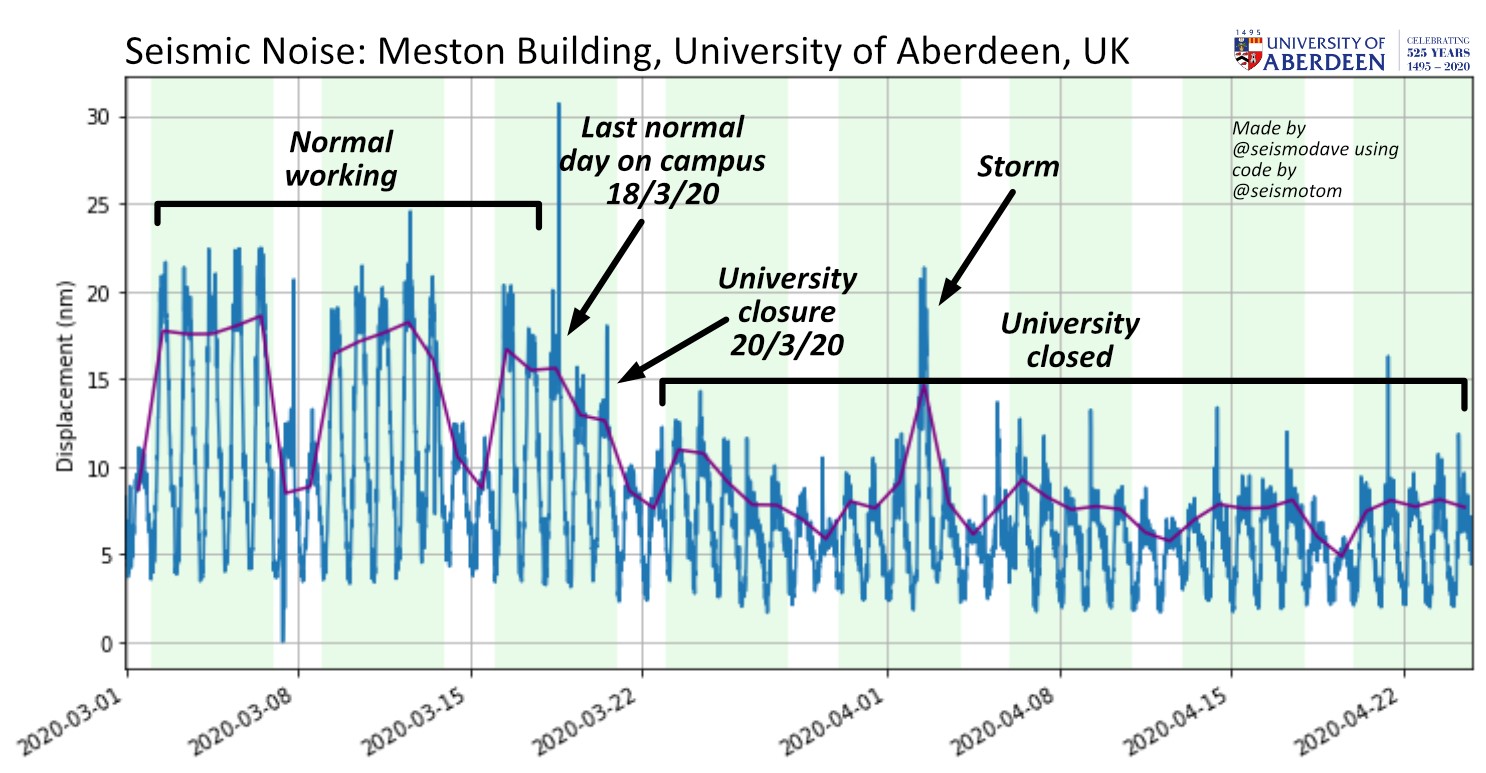
Vibrations due to natural and man-made sources are continuously recorded by seismometers across the world, either for research purposes or so-called “citizen science”. The COVID-19 lockdown has affected these vibrations, or “seismic noise”, through reducing human activity such as construction, traffic, trains, aeroplanes, etc., and so it is possible to track the quietening by examining the seismometer data.
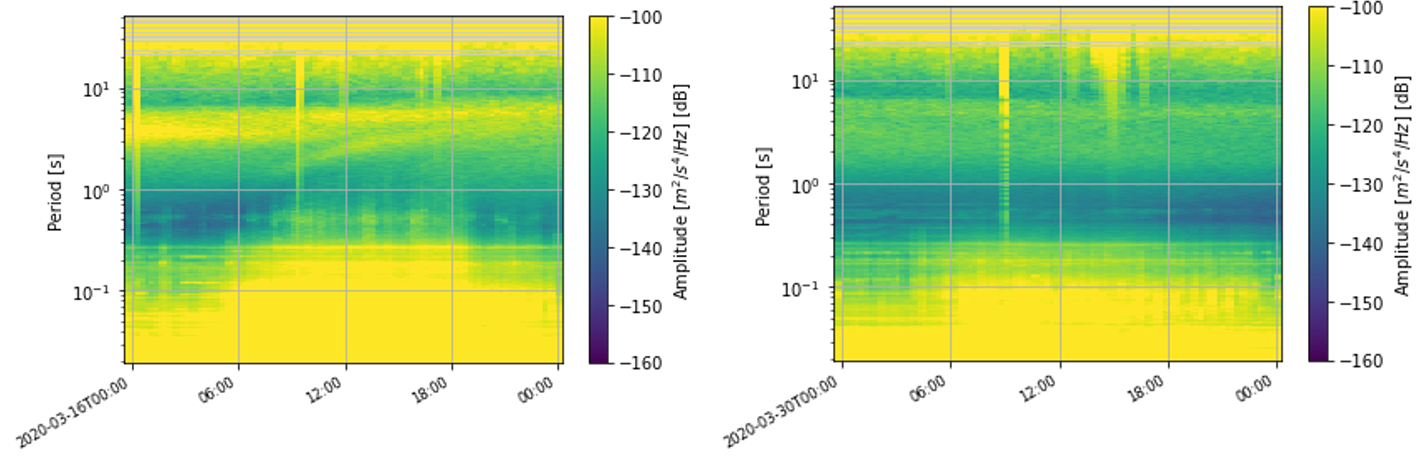
I am a seismologist in the Dept. of Geology & Geophysics and I used data recorded by a Raspberry Shake “citizen” seismometer (https://raspberryshake.org) located in colleague Dr. Dave Healy’s office to show an overall man-made (anthropogenic) noise reduction of about 60% on the University campus using code shared via Twitter by Dr. Thomas Lecocq (Royal Observatory of Belgium). The change is mostly caused by reduced activity as a result of the closure on March 20th of the University of Aberdeen’s King’s College campus due to COVID-19 restrictions, but also a snapshot of Aberdeen city from this location.
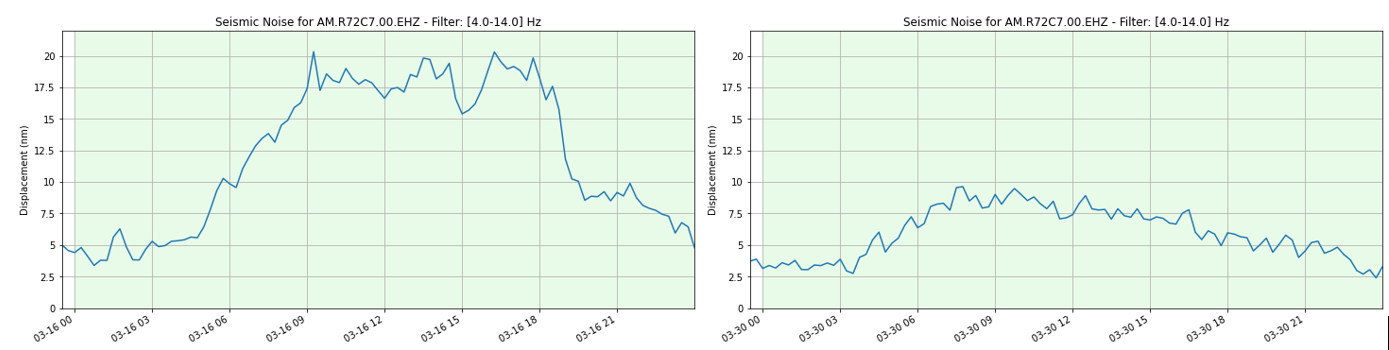
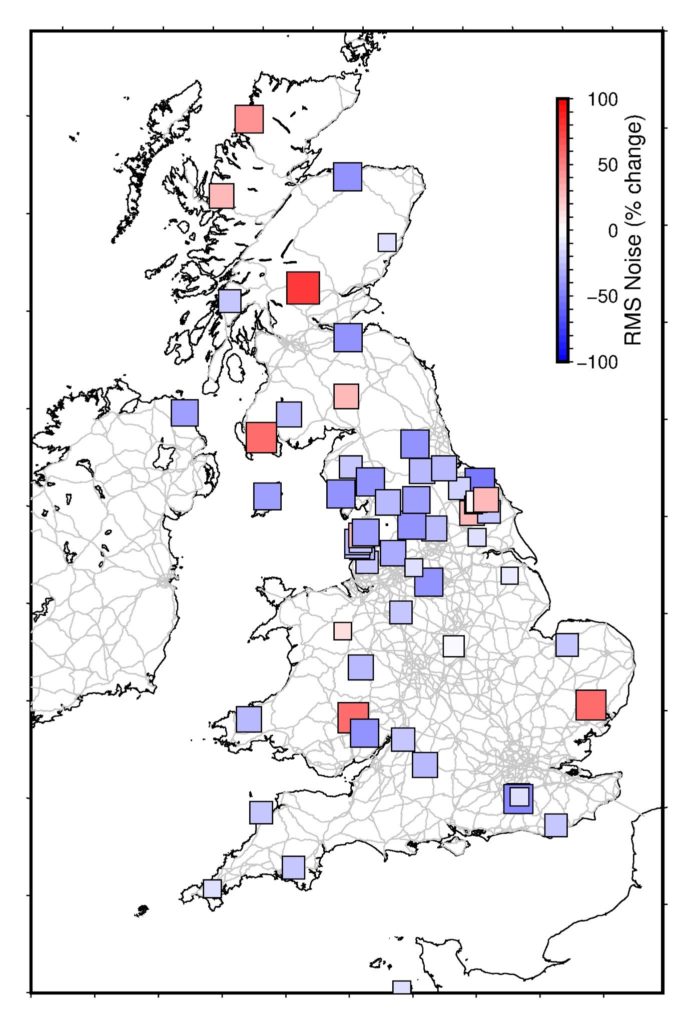
Across the UK, Dr. Brian Baptie has reported a typical 20-50% noise drop from the seismometer network run by the British Geological Survey:
And globally seismologists have reported seismic noise quietening of up to 80% (e.g. https://www.nytimes.com/2020/04/08/science/seismographs-lockdown-coronavirus.html?fbclid=IwAR1iqEyMF8KC8eH4tCGgE-6KmhhQrqmZv8nNwQulDqZieY7rH7qOMV23ljk, https://www.nature.com/articles/d41586-020-00965-x, https://www.nationalgeographic.com/science/2020/04/coronavirus-is-quieting-the-world-seismic-data-shows/).
In a link with another ongoing COVID-19 research project at the University of Aberdeen, Dr. Cornwell has converted the vibrations to sound and added them to Prof Pete Stollery’s soundmap project (www.tinyurl.com/covid19soundmap). By increasing the measured seismic noise frequencies by a factor of 100, it is possible to hear the difference in Earth’s vibrations over an entire day in a few minutes.
Whilst the lockdown is in place, seismic noise is reduced and so it may be possible to record natural phenomena, like earthquakes, more easily. However, the coming together of the world’s seismologists to monitor changes in the Earth’s vibrations, and the wealth of useful information recorded by members of the public with their own seismometers, shows some positive and unexpected outcomes of the COVID-19 pandemic. We will keep monitoring to track the Earth’s response during the transition back to normality.
For more information, follow these seismologists on Twitter:
https://twitter.com/seismodave/ – Dave Cornwell (University of Aberdeen)
https://twitter.com/seismotom – Thomas Lecocq (Royal Observatory of Belgium)
https://twitter.com/seismo_koel – Paula Koelemeijer (Royal Holloway)
https://twitter.com/BrianBaptieBGS – Brian Baptie (British Geological Survey)